Welcome back to the annual WP Fusion Year in Review! 🎉
In the spirit of open-sourcey-ness and transparency, I’ve been publishing these Review posts since 2018. You can check out previous years below:
- 2023 in Review
- 2022 in Review
- 2021 in Review
- 2020 in Review
- 2019 in Review
- 2018 in Review
- 2017 in Review
This is traditionally a long post, where we take a deep dive into all aspects of the business. Feel free to use the navigation at right to jump to whatever topics interest you.
A quick intro in case you’re new here—
#What is WP Fusion?
WP Fusion is a WordPress plugin for deeply integrating your website with your CRM or email marketing system. It’s often used on membership or e-commerce websites to collect and organize customer data, trigger automated emails and workflows, and personalize the WordPress user experience using CRM data.
This helps small business owners spend less time, making more money, from happier customers. It’s pretty great, but don’t just take our word for it.
WP Fusion launched in January 2015, so we are entering our eleventh year in business.
WP Fusion is developed by Very Good Plugins. We’re a small distributed team building and supporting open source plugins for WordPress, FreeScout, and other platforms. Some people say they’re “Very Good”.
As of January 2025, WP Fusion powers 34,658 websites and generates about $800,000 / year in revenue.
In the spirit of open source, I’ve been publishing these transparency reports since 2017. In them, I go over what we accomplished in the prior year, plugin usage stats, revenue metrics, support metrics, wins, fails, observations, and what we’re working on for the coming year.
Let’s dive in.
#Plugin updates and new features
We released 64 updates to the core WP Fusion plugin in 2024, generally every Monday.
We also have six addon plugins for Plus and Professional license holders, five of which had noteworthy feature updates this year:
- The Abandoned Cart addon had seven updates.
- The Enhanced Ecommerce addon had eight updates.
- The Event Tracking addon had three updates.
- The Media Tools addon had two updates.
- The Logins addon had one update.
#New CRMs
WP Fusion now supports 60 different CRMs and email marketing systems. In 2024 we added support for Encharge and ConvesioConvert.
#New plugin integrations
In 2024 we added 7 new plugin integrations, meaning WP Fusion now supports 170 plugins.
In order of release:
- Amelia: sync bookings and event registrations with your CRM, with support for custom fields and segmenting customers based on the selected service or event.
- LatePoint: sync appointment bookings with your CRM and apply tags based on the selected service and booking status.
- MasterStudy LMS: Sync students with your CRM, apply tags based on course and lesson progress, and auto-enroll students into courses using automations in your email marketing platform.
- Content Control is already a powerful plugin for controlling access to content on your site, we’ve added the ability to use the current user’s tags in your CRM as conditions when building your access rules.
- MemberDash (by LearnDash): Apply tags when users are added to membership levels, and automate membership level changes using automations in your connected CRM.
- Cancellation Surveys and Offers for WooCommerce Subscriptions: Apply tags in your CRM when users submit cancellation surveys or accept retention offers, and sync cancellation reasons and survey responses with your CRM to use in reports and automated followups.
- FluentCommunity: Control access to your community using tags in your CRM, apply tags based on activity in spaces and courses, auto-enroll users into spaces and courses using CRM automations, and sync engagement details with custom fields for use in reports and automations.
#New documentation
I believe good documentation is the heart of any software product.
In 2024 we published 30 new documentation pages, and made updates to 99 additional articles.
#Usage insights
When WP Fusion calls home to check for a plugin update, it includes some basic info about the customer’s site, including the name of their connected CRM, and which integration modules are active in WP Fusion. This helps us with support and feature development, and also lets us run reports on the most popular CRMs and integrations.
Note that we do not track which plugins are active on our customers’ sites, only which features are enabled within WP Fusion. So these reports aren’t necessarily indicative of the WordPress ecosystem as a whole, but rather the tools that people prefer to use when building sites that require a deep integration with marketing automation tools.
For this year’s reports we’re using a sample size of 19,143 sites that have called home for an update in the last 12 months, where WP Fusion has been fully set up (connected to a CRM).
#CRM Popularity

The most popular CRMs with WP Fusion in 2024 were ActiveCampaign, FluentCRM, HubSpot, Keap, and HighLevel.
Notable changes from 2023:
- HighLevel: 4.46% → 7.64%
- HubSpot: 7.7% → 9.35%
- MailChimp: 3.58% → 4.48%
- ActiveCampaign: 26.08% → 20.69%
- Infusionsoft / Keap: 11.04% → 8.1%
- Ontraport: 4.6% → 3.2%
Like 2023, we’re seeing a declining share in legacy systems like Infusionsoft, ActiveCampaign, and Ontraport.
In the years leading up to 2023, a large part of that shift was towards self-hosted platforms like FluentCRM and Groundhogg. This year the self-hosted segment has grown much more modestly, while HighLevel has picked up a ton of new users.
Keap raised their prices significantly in June of 2024. I know several people who saw their monthly bill increase by more than 2x overnight 😰.
Switching to a self-hosted CRM can be overwhelming if you don’t have a technical background, so switching from Keap to HighLevel is a straightforward choice since it has similar features, good support, and reasonable pricing (check out our HighLevel review here).
#Most popular plugin integrations
We can also see which integration modules are active in WP Fusion.
This helps us prioritize integrations for new feature development, but we can also compare with last year’s data to identify trends in plugin popularity.
#Ecommerce

#Key takeaways:
- WooCommerce lost 0.91%, though it remains dominant.
- SureCart saw a major jump (+1.25%), showing increasing adoption.
- Paymattic grew from 0.09% to 0.15%, while Upsell Plugin declined to 0.03%.
#LMS

#Key takeaways:
- LearnDash dropped 0.61%, but still dominates the market.
- Tutor LMS gained 0.76%, showing continued growth.
- LifterLMS saw a slight increase of 0.12%.
- Thrive Apprentice and WP Courseware also had small gains.
#Membership

#Key takeaways:
- Members saw a notable increase (+3.33%), making it the biggest gainer in this category.
- WooCommerce Memberships dropped by 1.58%, indicating a slight decline.
- Ultimate Member decreased by 1.4%, showing a dip in adoption.
- Profile Builder Pro gained 0.21%, while Restrict Content Pro and WishList Member saw slight decreases.
#Forms

#Key takeaways:
- Fluent Forms saw a significant increase (+2.38%), continuing its trend of growth.
- Gravity Forms dropped 1.41%, but remains the dominant form plugin.
- WPForms and Contact Form 7 saw small declines.
- WSForm doubled its share from 1.39% to 2.29%.
#Events and bookings

#Key takeaways:
- Amelia is a new integration for us, starting strong at 8.17%. (For the percent changes below, I’ve calculated them before adding Amelia to the chart, so they aren’t skewed by the new addition).
- Events Manager gained 2.31%, making it the biggest gainer over 2023.
- FooEvents grew by 1.41%, while Modern Events Calendar saw a 0.24% increase.
- WooCommerce Bookings declined by 1.56%, which may indicate a shift to other booking solutions.
- Simply Schedule Appointments declined by 1.47%.
#Page builders

#Key takeaways:
- Bricks saw a significant gain (+1.06%), indicating growing adoption.
- Breakdance increased from 0.32% to 0.54%.
- Elementor dropped slightly (-1.53%), but still dominates with 69.5% of the market.
While we can’t detect directly whether someone is using the block editor as their only page builder (since it’s installed on every site), we can count the number of sites that do not have any page builder loaded.
Out of 19,143 sites, that number is 3,612— i.e. about 81% of sites use one of the page builders above.
#Affiliates
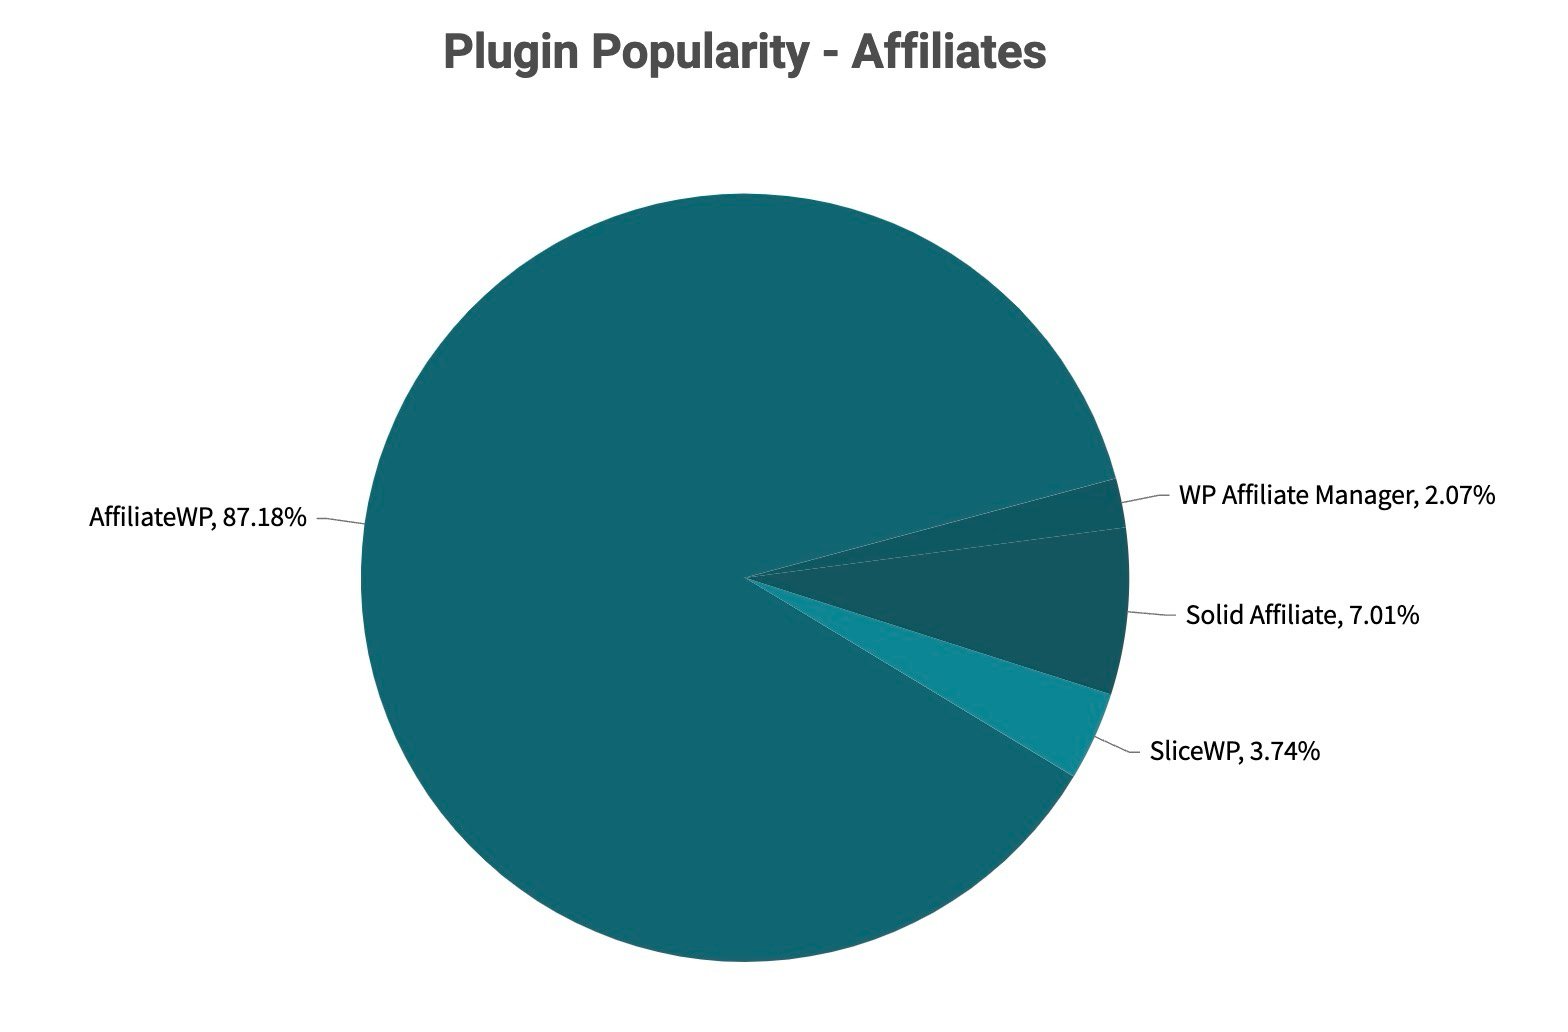
#Key takeaways:
- Solid Affiliate gained 2.44%, while SliceWP lost 2.59%.
- AffiliateWP saw a minor decrease (-0.11%), but still dominates.
#Custom fields and post types

#Key takeaways:
- Advanced Custom Fields held its dominant position at 75%
- JetEngine saw an increase of +1.47%, indicating strong growth.
- Pods and Toolset Types declined slightly.
#WP Fusion addons

Like last year, the Logins Addon and Enhanced Ecommerce are still the most popular of WP Fusion’s Plus Addons.
We added several new plugin and CRM integrations to the Event Tracking addon this year, and I’m happy to see it now in use on 6.3% of WP Fusion sites (up from 4% in 2023).
#Revenue
2024 was the first time we had a year-over-year decline in revenue, down 3% to $776k, with 25% fewer new customers than 2023.

I have some thoughts on why this is happening, and some strategies we’ve put in place to try and turn it around, but first the numbers:
Summaries for WP Fusion in 2023:
- Net revenue: $775,969 (-3%)
- Refunds: $39,740 (-13%)
- Refund rate: 5.2% (-14%)
- Revenue from license renewals: $582,795 (+6%)
- Revenue from license upgrades: $16,480 (-4%)
- Subscriber lifetime value: $1,024 (-13%)
- Commissions paid to affiliates: $6,020 (-48%)
- New customers: 486 (-25%)
#Renewal rates and churn
2024 was our best year yet in terms of first-year renewal rates. 65% of customers who purchased a license in 2023 renewed their license in 2024.

Our churn rate (the percentage of subscribers who cancel in a given month) held roughly steady at 2.7%.
#Refund rates
In 2023 refund rates for new customers hit a near-record high of 7.2%, and I never could figure out why.
(I think 2021 could be explained by Covid stimulus, and people buying WP Fusion without fully understanding how it works, but 2023 is a mystery 💁♂️).

I’m happy to see that’s recovered significantly in 2024, dropping to 4.5% (and 2025 appears on track to be even better).
Note that our overall refund rate of 5.2% (in the summary above) also includes refunded subscription renewals— usually when a customer misses the renewal notification email.
I’m mostly interested in tracking the new customer refund rate because it means our SEO, marketing, and documentation are aligned with the product experience.
In 2024, 95.5% of people who purchased a license chose to keep it after the 30-day no-questions-asked refund window, so I’m really pleased that that’s headed in a positive direction.
#New vs Recurring Revenue
We can also visualize revenue in terms of new vs. recurring.

In 2024 our revenue from new customers declined 22% to $256,796. Our recurring revenue increased 6% to $582,795.
#Black Friday / Cyber Monday
I’m not a big fan of running sales because we’re a small team, and it takes a lot of energy to plan and execute, which I’d rather dedicate to working on the product.
We’ve only ever offered one sale a year, for BFCM, and it’s always been a 30% discount off the first year of our annual plans.
This year was underwhelming, with a significant drop in revenue and new customers from 2023:
- Net revenue: $38,059 (-43%)
- Average order value: $320 (-17%)
- New customers: 25 (-53%)
This was a frustrating BFCM because I don’t usually put much effort into it other than updating the graphics from the prior year, sending out a few emails, and activating the coupon code the day of.
By comparison, in 2019 we brought in 130 new customers over the same four-day period, with no paid ads and very little effort 🤦.
With our new marketing team in place since August (see below), I thought this would be a good opportunity to flex our marketing muscle, and try some more resource-intensive initiatives.
This year we incorporated several new tactics:
- We reached out directly to customers with licenses that had expired in the last year, but still had WP Fusion active on their sites, with a list of new features since their license expiry, and an offer to renew their expired license at the BFCM discount.
- We contacted Personal plan customers who had WooCommerce, SureCart, and other supported ecommerce plugins active, and had a CRM which is supported by Enhanced Ecommerce, with a special upgrade offer to our Plus plan to take advantage of those features.
- We redesigned our Black Friday landing page, with new BFCM-specific videos.
- We ran three live-streams, simulcast to the website, YouTube, and Facebook, where we explored different use-cases for WP Fusion, and answered audience questions in real time.
- We ran a Facebook ad campaign with a lookalike audience based on our existing customer base, as well as a retargeting pixel to show ads to folks who visited the site but hadn’t bought yet.
Creating the targeted customer segments and tailored campaigns took a lot of planning and execution time.
We began prep in September, and across the whole team spent 62 hours and 47 minutes on BFCM-related prep.
Costs including labor, ads, graphic design, etc., came to $6,251.
At the end of the day, I’m not sure if it made much of a difference 🤔
Our largest customer demographic is in the US, and there was a fair bit of economic uncertainty in the air at the end of November. Other plugin business owners I’ve spoken to also experienced declines compared to 2023.
The few who did really well offered lifetime deals for BFCM— which I’ve been hesitant to do since LTD buyers are usually existing annual subscribers, so we lose the dependability of recurring revenue for a one time cash infusion.
I’m thinking about not bothering with a BFCM promotion at all next year, and instead shifting to a model where we run smaller, random sales throughout the year.
#Is WP Fusion in decline?
It certainly feels like it! 😅
It’s frustrating to feel like we’re doing more than ever, in terms of feature releases, publishing content, new products, videos, cross-promotion— and yet revenue declined this year for the first time.
Thankfully our churn rate (the percentage of customers cancelling subscriptions every month) remains quite strong, at 2.7%.

Every business is different of course, but Recurly Research has some stats on churn rates across a variety of business types, and suggests that 4% is a good benchmark.
For a subscription company, the average annual churn rate is 5-7%, and a 4% monthly churn rate is considered a good benchmark.
I take comfort in that. Generally, once people learn to use WP Fusion, they keep using it. We have many customers with subscriptions that have been active for over 10 years.
They don’t seem to be leaving us for a competitor, or deciding that we aren’t providing the level of support or product updates to justify the subscription price ✅
The problem is new customer acquisition. If we can’t sign up new users, eventually even a low churn rate is going to leave us with declining revenue.
In the chart below you can see new customer signups by month since we launched in February 2015.
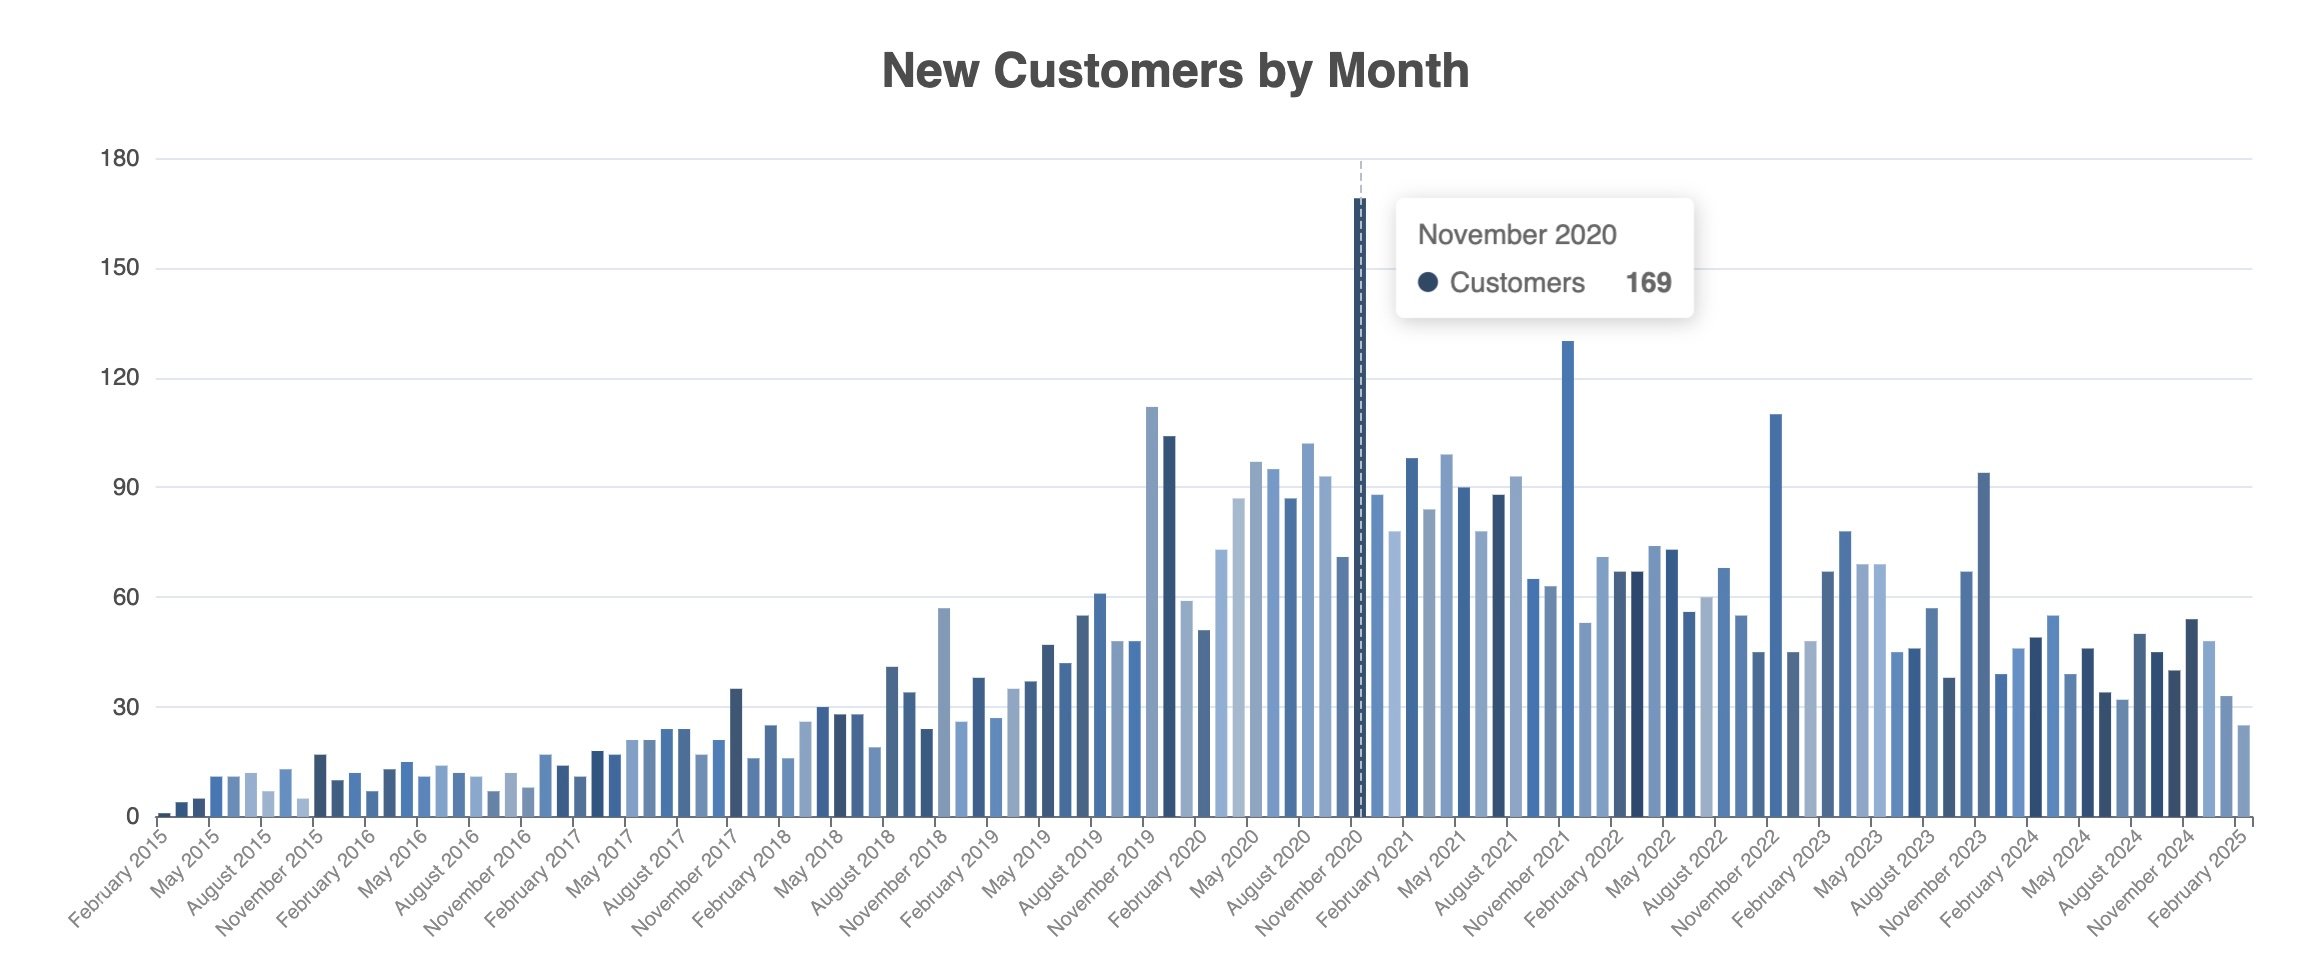
New customers peaked at 169 in November of 2020. The average for 2024 was just 40 new customers per month.
#So, what’s going on?
It might be the Google! 👀
WP Fusion is a powerful plugin, but it’s also very niche. We don’t compete in an established category like membership or ecommerce plugins, where we could market ourselves as a faster / cooler / sexier alternative to an incumbent.
Instead, we do really well with people who need to deeply integrate their unique WordPress site with their preferred CRM or email marketing system.
For things like sending SureCart orders into Klaviyo, or GiveWP donations into HubSpot pipelines, WP Fusion is really the only option aside from Zapier, which comes with usage-based pricing and data security concerns.
For people searching for specific combinations of plugins and ESPs, we used to rank really well, but it’s been declining steadily for the past few years.
I can only run a report in Google Analytics from 2021 to 2024, but even here you can see the decline in organic traffic.

New users from organic search declined from 6,500 per month at the start of 2021 to a low of 2,400 per month in June of 2024.
(The spike in October was a result of our Cease and Desist letter to Automattic, which picked up a lot of related organic search traffic around the #WPDrama, but resulted in very few conversions).
The trends are more obvious in our Ahrefs keyword positions over the last five years.

In July of 2023 we had 1,300 keywords in the top 20 positions on Google search results (450 in the top 10). They’re currently sitting at a low of 370 keywords in the top 20.
We have always had a strong correlation between organic search traffic and new customer signups.
In 2021 we averaged 77 new customers per month, by 2024 that has declined 48%, to 40 new customers per month.
Compared against organic search traffic— in 2021 we averaged 4,695 new users per month, and that has declined 34% to 3,077 per month in 2024.
Of course correlation does not imply causation, but many other businesses have experienced a similar effect.
#What are we doing about it?
In hindsight, it was naive to think Google would continue sending us thousands of warm leads every month until the end of time. So, we’re making some changes.
In August, Katy Laurel joined us full time as director of marketing and partnerships 🎉.
Since then we’ve hired two writers, a video producer, and have built up a marketing strategy to try and diversify our inbound traffic sources, while trying to recover as much organic traffic from Google as possible.
It was hard work creating a new department from scratch, but since we’ve gotten the ball rolling we have:
- Published 20 new blog posts, with a mix of reviews, technical tutorials, and introductory guides for beginners.
- Published 19 videos to our YouTube channel, four live streams, and a series of “shorts” (which have performed surprisingly well).
- Begun sending a monthly newsletter to customers and prospects, with a summary of the new features and integrations released that month, links to new content on our blog and YouTube, and featuring case studies and success stories from users.
- Started cross-promotion initiatives with the CRMs and plugin companies we integrate with, to try and build mutual backlinks.
- Completed an exhaustive technical SEO audit of the website: removing thousands of pages with low content value, adding alt tags to 2,900+ images that were missing them, fixing thousands of instances of meta descriptions or titles that were either missing or too long, and fixing almost all broken links and redirects.
- Created “related resources” links between our videos, documentation, and blog posts to help people (and LLM scrapers 🤖) better access related content.
- Started prompting customers who access WP Fusion via an app marketplace (like HighLevel, HubSpot, or ActiveCampaign) to leave reviews in their respective marketplaces.
We also updated our pricing table to more prominently feature our free plugin, and instead of sending people to WordPress.org, we first collect their email address and deliver the plugin files from this site.

This protects us against any future instability on WordPress.org, and lets us follow up with free users via a drip email sequence containing tips on how to get started, and the features available with a paid license.

#Is it working?
Too soon to say.
Generally, big changes in marketing strategy take about 6 months to start showing results.

Looking in Ahrefs, there might be a hint of an increase in organic impressions following the post-holiday slump in early January, but it’s really too soon to tell.
The plan is to give it a full year, until August 2025, to see what’s worked and what hasn’t— and adapt based on the results we observe then.
Of course we’ll keep you, our dear readers, updated on any successes or missteps we make along the way 🙌
#Support and development stats
Back to the stats!
Customer support volume stayed at roughly the same levels through 2024.
Across email support (via FreeScout) and chat support (via Chatra) we had 4,036 support conversations (-6%), from 1,772 customers (-7%), with 8,176 messages received (-11%).

My personal output responding to support tickets went down again this year.
There’s basically nothing our head of support, Ace, can’t handle 🦸, but sometimes I’ll jump in when it’s a particularly gnarly technical issue.

This year I sent 1,514 replies to customers (-26%), and wrote 129,793 words (-25%) 😎.
#New customer support requests
This is a tricky calculation but one I find especially insightful. We can cross reference license key purchases with support tickets and calculate the percent of customers who request support within the first 30 days after purchase, as well as the first year.
If the number is going down, this means users are finding the resources they need inside the plugin and on our website before they need to contact support (or it just means we released fewer bugs 🙈).

2024 marks the best year yet for new customer support requests (which may also explain the decline in refunds 🤔).
15.3% of new customers requested technical support within the first 30 days after purchase, and only 25.4% requested support at some point within the first year.
#Feature requests
In 2024 84 feature requests (-8%) were submitted via our portal, and 46 were completed (+12%).

#Time

I’m religious about tracking my time (I use a StreamDeck on my desk connected to Toggl).
In 2024 I spent 761 hours working on WP Fusion (+6%)

The time breakdown is similar to last year’s, though this year I’ve added a category specific to Content Marketing (blog posts, videos, newsletters), which is separate from the more general “Promotion” (podcasts, interviews, etc. that I do on other sites or blogs).
Content Marketing was the third most time-consuming task in 2024, after support and development.
In addition to myself, the team spent:
- 1,919 hours on support (-4.6%)
- 538 hours on development (-30%)
- and 605 hours on content (+3,261%)
#Reflections
This was the first year I actually managed to achieve most of the goals I set out at the end of last year’s review:
#Content
“2024 is going to be the year of content”
We invested over 600 hours into content in 2024 and now have a talented team of writers, designers, and video producers, all working under a brilliant marketing director, and operating on a schedule that’s planned months in advance 💪
Before this year, I wrote almost all the content myself, and rarely planned anything more than a few days in advance 😅
#Development
We now have a standard set of development tools and scripts that are shared across everyone’s development environments, including rules for AI (we use Cursor).
We’ve consolidated our block editor integrations into a single build process, and we’ve created a custom React component to handle our CRM tags select UI, which can be shared across integrations (and used by other plugins).
PHP code and documentation standards are now enforced automatically via BitBucket pipelines, and we’re about to move all our repos over to GitHub to be able to unlock further process automation via GitHub actions.
Bringing in a new developer used to take a week to get them up to speed, now we can have someone onboarded and contributing code in the same day 🔥
#Price increase
It was scary to change something that’s worked for so long, but after almost 10 years with the same pricing, it needed an update. In June we increased the prices on all annual plans by about 20%.
I wrote a retrospective on that in September, if you’re interested to learn more.
TLDR: conversion rates did not go down, but average order values only increased by 10%, as new customers shifted towards the cheaper Personal plan and away from the Plus plan.

In retrospect, I think the $130 price difference between the plans is too much, so we will probably look into either adjusting the Plus plan pricing, or offering an introductory discount for that plan sometime in Q2.
#WordCamp Asia
We had a blast sponsoring WordCamp Asia in Taipei in March, and were able to fly most of the WP Fusion team to Taiwan to join us.


I was thrilled to finally get to meet our support lead Ace in person— after working together every day online for nearly four years! 🧡
#What’s next?
#Coming around to blocks
Now that the block editor is becoming more mature, and we’ve laid the groundwork for adding WP Fusion settings to blocks, 2025 will bring tighter integrations with plugins that use block components for their admin UIs.
In late 2023 we added a SureMembers integration as an initial experiment, and we refined the processes when we integrated with the new GiveWP Visual Form Builder in 2024.

We’re currently working on support for custom fields and email optins on the block-based WooCommerce checkout, and we’re exploring an integration with The Events Calendar’s block-based ticket editor.
(I’m even writing this post in the block editor— something I never thought would happen 🫢)
#Deeper partnerships and collaboration
Now that we have a team in place focused on partnerships, expect to see closer collaboration with other plugin companies in terms of cross-promotion, improved compatibility, and WP Fusion integration available from day one when new products launch.
We’re even exploring ways to unlock some pro features of WP Fusion for free when WP Fusion Lite is installed alongside selected plugins 🤫.
#EchoDash
I reflected in 2023 on the increasing difficulty of developing in WordPress, and the trepidation I feel when major changes to core (the block editor, Full Site Editing, the upcoming admin redesign) are being released in a half-broken state onto live sites— seemingly without any long-term plan or vision.
The Google search algorithm updates also reinforced how vulnerable we were to unexpected changes by a provider or platform.
The #WPDrama that started at WCUS added further to this feeling. It’s uncomfortable to realize that your livelihood, and that of your team, basically comes down to whether Matt Mullenweg wakes up in a good mood on any given day.
So I’m personally diversifying out of WordPress, just a little bit.
Since June I’ve been splitting my time between WP Fusion and EchoDash, which is a new SaaS service I co-founded.

In running WP Fusion (and spending countless hours wrangling the charts for this yearly review 😅), I’m constantly running up against the fact that there is just too much going on across all my apps and services to reasonably keep on top of everything.
I keep eight different browser tabs open at all times, plus have notifications coming into Slack channels, email, Discord servers, and project management software that runs on my desktop and mostly (but not always) sends the right notifications to my phone.
So, EchoDash is my idea of solving that problem 🤓. It’s going to be a real-time feed for anything and everything that matters to you online.
We use AI to parse incoming data from any source imaginable (even forwarded emails), extract the relevant points into usable data, and present it to you in a chronological feed.

When it’s ready, you’ll be able to see everything happening in real time across all your services, and then configure alerts, charts, and schedule summaries around the things that matter most to you.
- In the WordPress context— that could be a PHP error that happens within 10 minutes of an automatic plugin update. Or a student who hasn’t logged in for a while, who comes back to restart a course.
- As an agency owner, it could be a Slack message when one of your clients installs a new plugin.
- As a fitness coach, it could be a browser alert if one of your clients didn’t complete their training goals for that day.
- Or you might just want a daily email digest of any packages out for delivery.
We have a long way to go, but we already have a working prototype at https://echodash.com/, I invite you to give it a try and let us know what you think.
EchoDash is completely free while in beta 🙂
We also have an EchoDash plugin that can track events in real-time across WordPress core and 12 other plugins (with more to come). And a native integration with our error monitoring plugin, Fatal Error Notify.
Curious, but not impressed yet? Drop your email below and we’ll let you know as new features are released 👇
#Conclusion
I’m always in awe of founders like Syed Balkhi or Katie Keith who have their Year in Review posts ready to go on January 1st 🙇
Every year I start writing this I find more things I’m curious about— which lead to more queries to power more complex charts, which inevitably uncover some problem or inefficient process on our site or in our products, which inevitably need to be fixed 🤦♂️
Next thing I know it’s nearing the end of February and I still haven’t published anything.
Maybe I should stop calling it “Year in Review” and start calling it “Spring Cleaning” 🌷😁
Thanks, as always, for reading. And thanks especially to our customers, who have supported us for over a decade now 🧡.
It’s been an amazing experience to collaborate on open source software with thousands of people all over the world, and get paid to do it. I feel truly blessed.
Wishing you all a fantastic 2025, whatever it may bring!
– Jack


10 thoughts on “2024 in Review and Transparency Report”
Fascinating read, thanks. I’m super impressed with the new marketing content. Katy has nailed it from a human perspective, so let’s hope it translates into more business in what is a challenging economic environment.
And overall you have an incredibly good team and drive. Definitely one of my absolute top essential plugins.
Thanks Chris!! 😊
You and your team are always amazing.
But why you dont start with google campaign? Is lees expensive of facebook and have more focus on the specific target.
You have entire countrys with very low level of knowledge of you plugin you can try to focus on that type of country with content and ads!
Im try to talk about wpfusion with all people i know.
a lot of people have wordpress and other crm combination but they know just your competitor…
About echodash fantastic idea! I have similar problems!
Just for curiosity how much of you work and interna proces is automated?
Thanks Edoardo!
I’ve tried Google a couple of times but never had any luck, even working with professional agencies to run the campaigns. The last time we tried it in 2022 we spent over $12k and only got one customer: https://wpfusion.com/news/2022-in-review/#fails 🤦♂️
We have a *ton* of processes automated now. And AI has probably 10x’d my speed as a developer. I should really write a post just about that as there’s a ton of stuff I’ve learned over the last year.
Loving this report.
How did you calculate new customer support rates? I’m pretty sure we’re using the same (or very similar) tooling, so I’d love to be able to track that myself.
This is the query https://github.com/jack-arturo/edd-appsmith-stats/blob/main/pages/Support%20and%20Demos/queries/CustomerSupportRequestRates/CustomerSupportRequestRates.txt
Our support form is here https://wpfusion.com/contact/
So it’s cross-referencing the license key from input #4 with the customer signup date, and checking that input #3 (“Subject”) is “Technical Support” 😎
Thats very cool, thanks for sharing it
Wow, thanks so much for sharing the query! I’m excited to dig into these numbers.
Awesome read. I was waiting for this along with Ketie’s.
You two write “year in reviews” with full transparency, I respect you guys for this. Got a lot of insights. Thanks for sharing this.
Note: You are on the right track on the marketing side. It will take significant time to get results (as always with content marketing), but I hope you’ll get results.
Best of luck.
Thanks Nishat!!